That women now comprise 47 percent of the U.S. laboring force, according to Department of Labor (DOL) statistics in 2015, makes the analysis of U.S. working women necessary. In analyzing data collected regarding U.S. working women, it can be concluded that half does not mean equal. In other words, although almost half the U.S. workforce, women continue to experience the effects of the intersection between capitalism, male supremacy and misogyny in the workplace through lower pay than their male counterparts and lower numbers of high-paying, high power and prestige jobs. This is especially the case for working women of color, and trans working women.
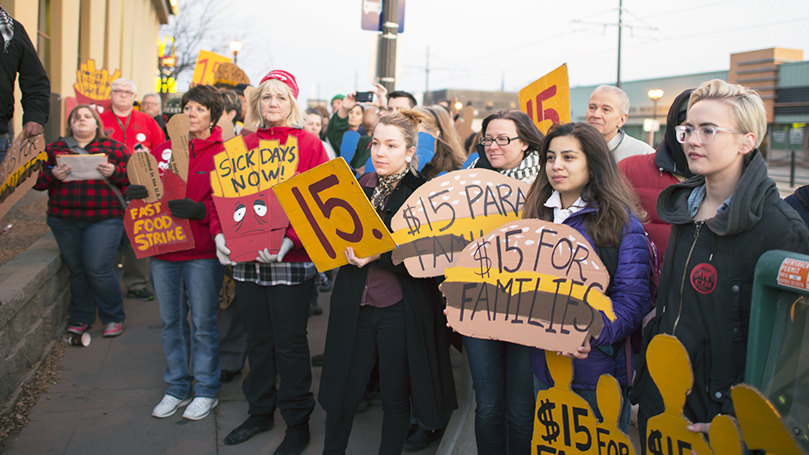
First, this report will look at the types of work women perform and how much they are paid for their work. Second, we will examine women in relation to poverty, unemployment, and homelessness, since they make up 60 percent of minimum wage workers. Next, the state of childcare will be analyzed as it relates to women, since 75 percent of U.S. families have a “working mother.” Third, though scant information is available about trans working women, their working conditions will be analyzed, since, as is the case with women of color, trans women are “last hired, first fired.” Finally, this report will analyze unionization among women, since they comprised 45 percent of union membership in 2014.
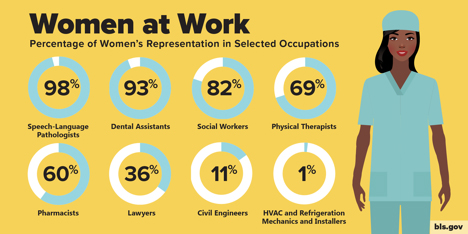
Employment can be broken down into the types of work women perform and how much they are paid based on the type of work. With regard to the types of work it can be concluded that women workers do not have the same amount of diversity as male workers and are relegated to a form of workplace segregation. For example, in a report conducted by the DOL, almost 40 percent of women work in a profession where they make up 75 percent of the workers in that particular field. For example, 98 percent of speech-language pathologists are women as well as 60 percent of pharmacists, and 82 percent of social workers.
Another DOL report stated that most women work in either the professional/managerial fields 45 percent; sales 30 percent; or service 21 percent. Comparatively, 16 percent of men work in service positions and 14 percent in sales.
The difference between the types of work for men are made up in the manufacturing 17 percent; and construction 16 percent; Consider that women make up 1 percent of construction workers and 6 percent in manufacturing.
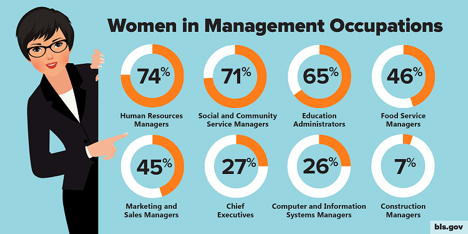
The label “professional/managerial” is a misnomer when it come to women. The majority of professional and managerial positions that are filled by women are in healthcare and education – positions that are not considered high-value and are not well-paid. Women make up managerial positions that are not considered high powered, like human resources managers, of which women comprise 74 percent , or 71 percent of social service managers.
On average, in 2015, women made $726 per week, while men brought home $895 for the same amount of time. This gap in pay is present even when men and women work in the same field, and despite whether the positions were high or low income. For instance, with respect to jobs deemed professional, women with positions that pertain to computers and mathematics made $1245 per week, while men made $1503. Although there are more women who work in banking than men, women earned $1073 per week, compared to $1436 for men. The gap in pay is present for low-wage working women as well; in hospitality, women made $490 per week compared to $577 for men. In food preparation and healthcare support, where women workers outnumber men, women took home $414 and $490, respectively, while men earned $481 and $577. Among U.S. women, both race and education matter in employment and pay.
While 37 percent of jobs held by black women could be classified as professional and/or managerial, this figure is compared to 42 percent for white women. In a more extraordinary gap, while half of Asian women are considered professionals or managers, only 27 percent of Latina women shared the same title. In the service field, white and Asian women account for 20 percent of workers, compared to 27 percent of black women, and 31 percent of Latina women. With race, education can account for the discrepancies. In 2015, 4,360,000 Black women workers had only a high school diploma, yet 3,600,000 have a college degree. Of Black women with a college degree 76 percent worked, compared to 54 percent with only a high school diploma. For Asian women, only 1,368,000 of workers only have a high school diploma, compared with 3,474,000 with degrees. This is most pronounced for Latina women – 2,708,000 have degrees, compared to 4,872,000 without even a high school diploma.
While African Americans made up 12 percent of the total U.S. population, they represent 39 percent of homeless people, and 45 percent of sheltered people, or folks who live in shelters full-time. Black women made up a large number of these sheltered persons; in L.A., for example, at least 40 percent of sheltered persons are Black women. In 2016, the rate of poverty in the U.S. was 14 percent , yet the rate for Black folks was 24 percent . Poverty can be broken down even more into “deep poverty,” where a family brought in under $6243 in a year. Almost half of families considered living in poverty are under this category, and 75 percent working-age folks in families living in deep poverty were unemployed for at least 1 year. The highest rate for deep poverty was that of Black women, at almost 11 percent.
Education and race also matter in unemployment. Black women had the highest rate of unemployment among women in 2015, at 7 percent . For Black women with a degree, the unemployment rate in was 4 percent , yet for women without a high school diploma, the rate was almost 17 percent . White women with degrees had an unemployment rate of 2.5 percent, with about 3 percent for Asian women. Latinx women with degrees shared a similar percentage of unemployment with White and Asian women, and percentages for unemployment for white and Latinx women without high school diplomas was the same, around 8 percent.
With lower pay, and less positions held at higher-pay, high-power and status jobs, child care cost have increased twice since the recession in 2008, to $9589 per year at a child care center. According to the Economic Policy Institute, in some states like California and Wisconsin, yearly childcare costs more than in-state school tuition. Low-income women can get trapped in a cycle where they work to to pay for child care, but can’t afford childcare when they work. For example, a minimum-wage worker in Alabama would need to work full time for 19 weeks, or from January to May, just to pay for child care for one infant. Again, race matters: Only 5 percent of white women needed government assistance to cover childcare cost, compared to 12 percent of Black women in 2002. And let it be noted that women still only get 12 unpaid weeks of maternity leave.
So far, this report had included statistics of cis-women, one reason being that data on the status of working trans women is scant. According to a report produced by the National Center for Transgender Equality:
“an overwhelming majority (69 percent ) had experienced a negative job outcome such as being fired or denied a job because of being transgender, nearly half (48 percent ) had experienced homelessness, and nearly a third (31 percent) lived on less than $10,000 a year.”
“More than one in four transgender people have lost a job due to bias, and more than three-fourths have experienced some form of workplace discrimination. Refusal to hire, privacy violations, harassment, and even physical and sexual violence on the job are common occurrences, and are experienced at even higher rates by transgender people of color.”
While trans women, and Black women, suffer the harshest effects from the intersection of capitalism and male supremacy, Black women also have the highest rates of union membership among women.
In the U.S., a little over 10 percent of employed persons belong to unions, yet the rate of Black women workers so far in 2017 is 12 percent , compared to 10 percent of Asian and Latina women workers. Black women’s’ prevalence in the public sector also allow for greater union representation. Black women workers who belong to unions enjoy $799 per week compared to the $616 of non-union workers. Working women of all ethnicities, in 2014, made up 45 percent of all union members in the U.S. Unionized women get 30 percent more money each paycheck, and more insurance coverage than non-unionized working women. Women have taken greater leadership opportunities that unions have historically provided. In 2015, 3 of the 5 officers of UNITE were women; in the same year, women comprised half of the “leadership” for SEIU, and 40 percent of AFT Vice Presidents.
Editor’s Note: On March 3, 2018 the CPUSA held a conference on The Fight Against Male Supremacy and Misogyny in Chicago. This article is one of several workshop presentations.
Image: Creative Commons 3.0
Sources:
“Current Population Survey (CPS).” Bureau of Labor Statistics. 2016. https://www.bls.gov/cps/
“Data & statistics.” UN Women Watch. 2016. https://womenwatch.unwomen.org/data-statistics
“Domestic Violence and Homelessness: Statistics.” Family and Youth Services Bureau, ACF. 2016. https://www.acf.hhs.gov/fysb/resource/dv-homelessness-stats-2016
“Early Childhood Program Participation, From the National Household Education Surveys Program of 2012.” U.S. Department of Education. 2013. https://nces.ed.gov/pubsearch/pubsinfo.asp?pubid=2013029rev
Enrollment of 3-, 4-, and 5-year-old children in preprimary programs, by age of child, level of program, control of program, and attendance status: Selected years, 1970 through 2015. U.S. Department of Education. 2016. https://nces.ed.gov/programs/digest/d16/tables/dt16_202.10.asp?current=yes
“New Report on Transgender Experiences in Sex Work Recommends Decriminalization.” National Center for Transgender Equality. December 7, 2015. https://transequality.org/press/releases/new-report-on-transgender-experiences-in-sex-work-recommends-decriminalization
Report of Minimum Wage. Bureau of Labor Statistics. 2014. https://www.bls.gov/opub/reports/minimum-wage/archive/characteristics-of-minimum-wage-workers-2014.pdf
Tyson, Laura D’andrea. The Significance of the Minimum Wage for Women and Families. March 7, 2014. https://economix.blogs.nytimes.com/2014/03/07/the-significance-of-the-minimum-wage-for-women-and-families/
“Union membership rate 10.7 percent in 2016.” The Economics Daily: U.S. Bureau of Labor Statistics. https://www.bls.gov/opub/ted/2017/union-membership-rate-10-point-7-percent-in-2016.htm
“Women in Unions – Women in the States.” Institute of Women’s Policy Research. 2018. https://statusofwomendata.org/women-in-unions/
 Join Now